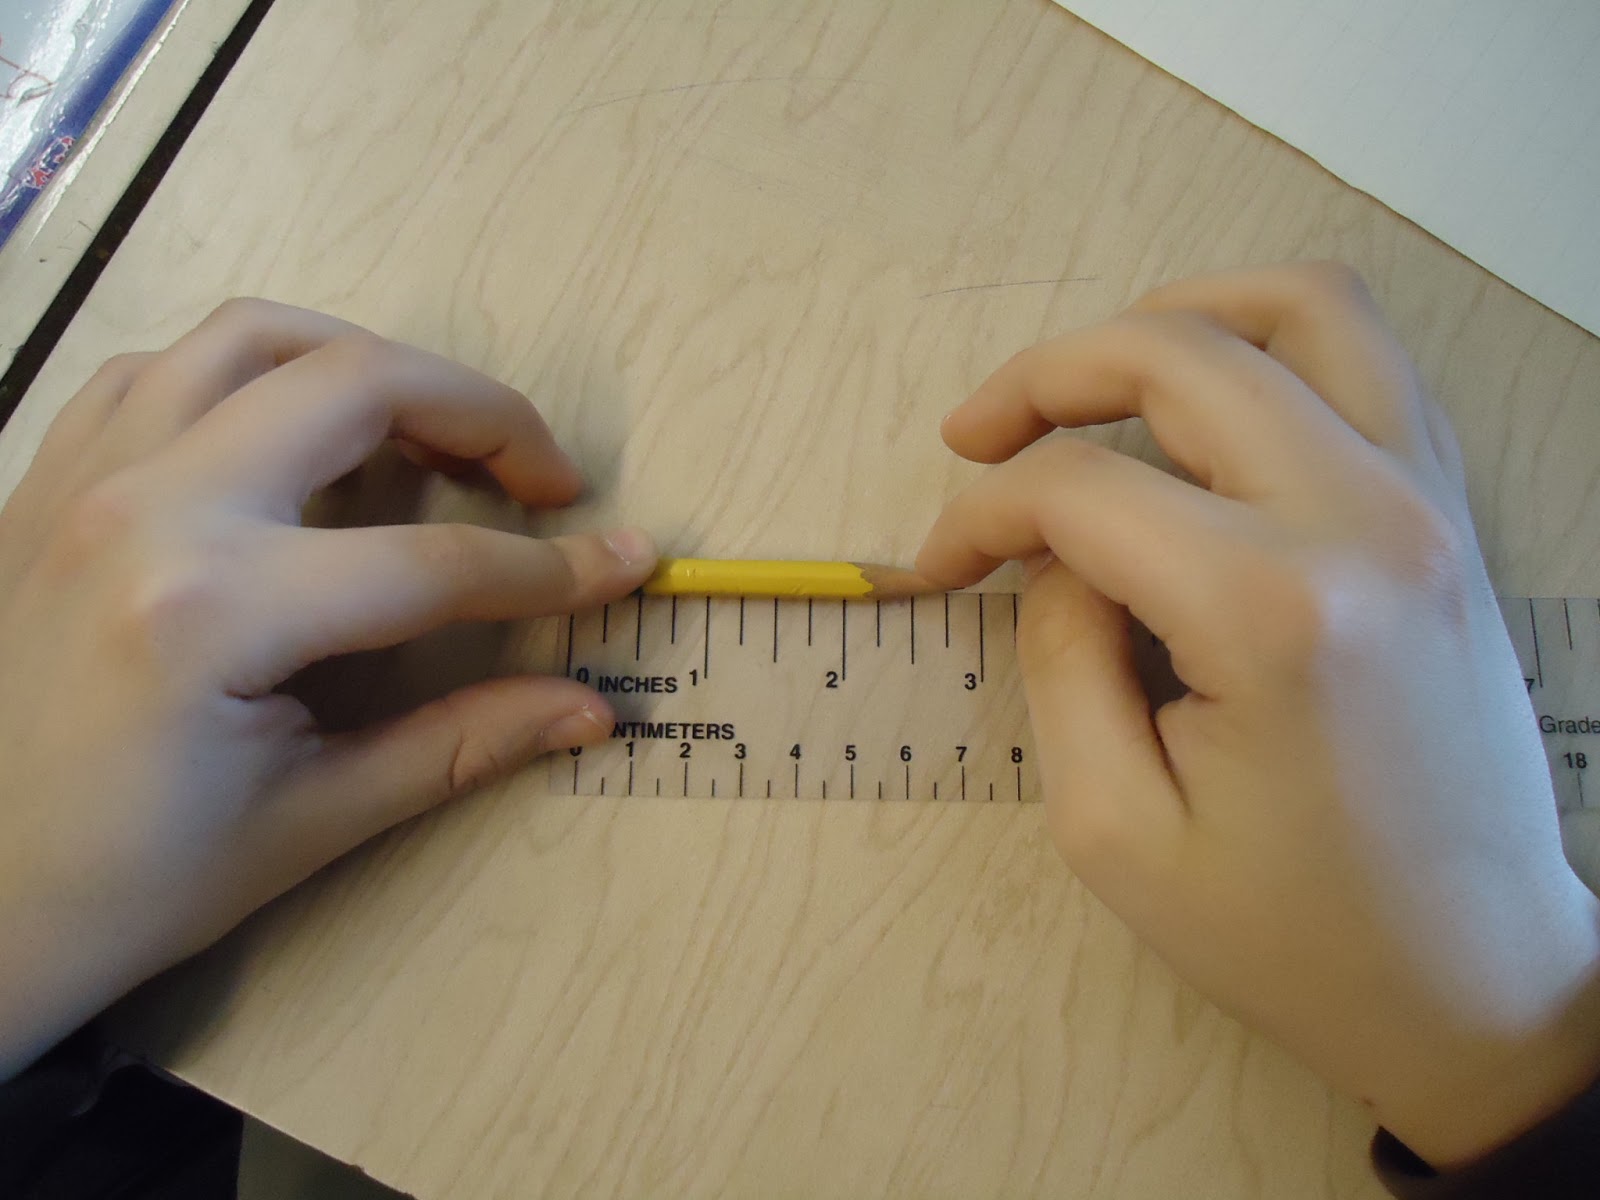
Measuring to fractions of an inch and making line plots
It was a busy week! I finally got to tackle one of the new common core standards for grade 4 that I have been waiting to sink my teeth into!- CCSS.Math.Content.4.MD.B.4 Make a line plot to display a data set of measurements in fractions of a unit (1/2, 1/4, 1/8). Solve problems involving addition and subtraction of fractions by using information presented in line plots. For example, from a line plot find and interpret the difference in length between the longest and shortest specimens in an insect collection.
So... here is how I addressed this standard with my fourth graders
We measured pencils to the nearest quarter inch (I know the standard wants 1/8ths but we were not there yet) I divided the class into 4 groups, gave each group a pile of pencils a bunch of rulers and some scrap paper. They were told to measure their pencils to the nearest quarter inch and record their results. Here is one groups results
Several groups got really into making sure they were putting the measurements in numerical order and ended up arranging their pencils from smallest to largest before beginning.
I drew a line plot on the white board and as the groups finished, they came to the board and plotted their results
Here is what it looked like when it was done! Each group decided to use a different color.
Here is where the fun began!
We gathered around and I started asking questions, focusing on interpreting line plots, fraction equality, scale, and fraction addition and subtraction. Here is a sampling of some of the questions
Why did I chose to start and end the number line where I did?
What do the small marks between the numbers mean?
What is the most common pencil length?
How many pencils did we measure?
How much longer is the longest pencil than the shortest pencil?
If I put the three shortest pencils end to end, how long would that be?
This led to a GREAT discussion. I can see lots of applications to this in science class. We MIGHT do this again and measure something to the nearest 1/8 of an inch but we will probably try to tag team this lesson with science class and make a line plot of measurements and data that are important for scientific purposes. We shall see
Two more pictures
How do you plan on addressing this new data standard?
To read more about how I took this lesson to the next level, click here to check out my guest post on Minds in Bloom about taking this standard to the nearest eighth of an inch.


0 Komentar untuk "Represent and Interpret data: Common Core Style "